Gross Margin Under Variable Inference
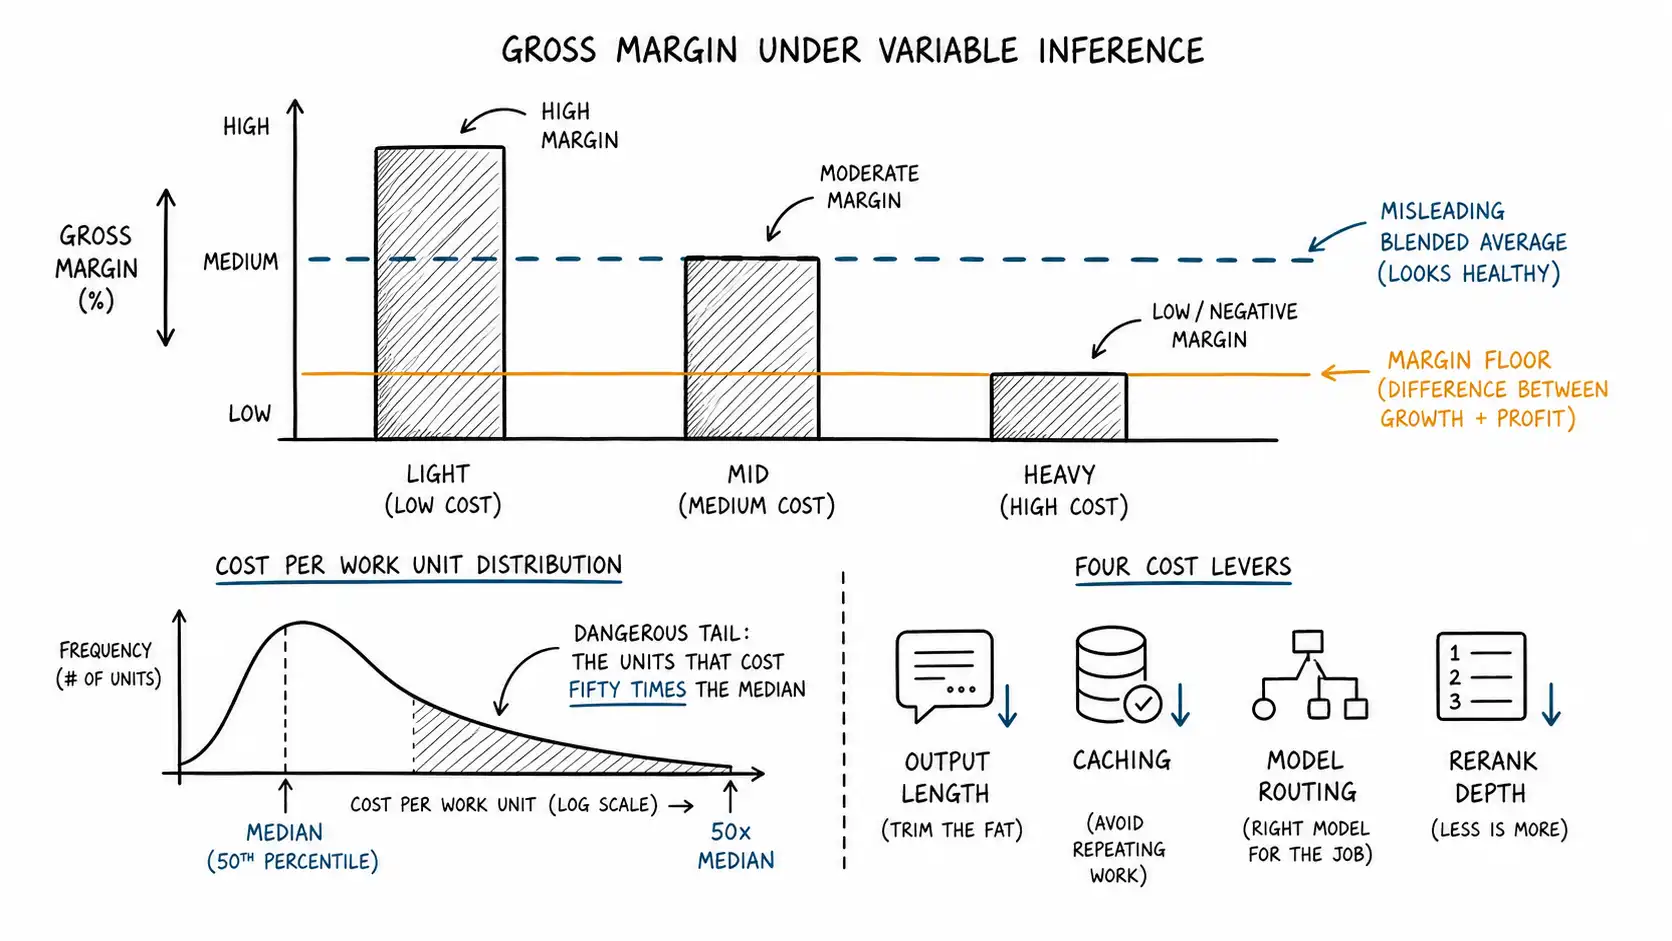
When cost moves with usage, a single average margin lies to you; you have to model the distribution and the tail.

Pricing software that thinks starts by pricing units of resolved work against variable inference, review, and risk cost.
Here is a number that should bother every AI founder more than it does: the most useful figure in traditional SaaS finance, blended gross margin, is close to meaningless for an AI product. Not wrong exactly. Meaningless, because it hides the thing that will actually decide whether you survive: the distribution of margin across customers and across units.
In a near-zero-marginal-cost business, the average tells you almost everything, because every customer has roughly the same margin. In a variable-inference business, the average is a blend of profitable light users and loss-making heavy users, and the blend can look healthy right up until the mix shifts and it collapses. You cannot manage what an average hides. So this chapter is about modeling margin the way variable cost actually behaves: as a distribution with a dangerous tail, not a single number on a slide.
Why the average lies
Recall the two teams from the seat-pricing chapter, both paying eight hundred dollars, one costing eight dollars and one costing sixteen hundred. If those are your only two customers, your blended gross margin is positive only because the light team subsidizes the heavy one. The instant you sign three more heavy teams, the blend flips negative, and nothing about your pricing changed. Your average margin moved because your mix moved, and you had no warning because you were watching the average.
This is the core hazard of variable inference: your margin is a function of who uses you and how hard, not just what you charge. A traditional SaaS company can quote one gross margin and mean it. An AI company that quotes one gross margin is quoting a snapshot of its current customer mix, and that snapshot has a built-in expiration date.
The public markets have started forcing this into the open. Several public SaaS companies began disclosing inference-cost ratios separately in their financial discussion in early 2026, typically running 4 to 9 percent of revenue, and multiple vertical-SaaS firms disclosed 6 to 9 points of year-over-year gross margin compression attributed explicitly to AI, per coverage of the AI COGS problem. When auditors and investors start asking you to break out inference cost, the era of hiding behind a blended number is over.
Model the distribution, not the average
The fix is to stop thinking in a single margin and start thinking in a distribution. Concretely, segment your customers by usage intensity and compute margin per segment. The simplest useful version is deciles of usage, or even just three buckets.
| Segment | % of customers | % of revenue | % of AI COGS | Segment margin |
|---|---|---|---|---|
| Light (bottom 50%) | 50% | 30% | 8% | 92% |
| Mid (next 40%) | 40% | 45% | 38% | 78% |
| Heavy (top 10%) | 10% | 25% | 54% | 41% |
This is a representative shape, not a specific company. Read it and the danger jumps out. Your top 10 percent of customers generate a quarter of revenue but more than half of your AI cost, and their segment margin is barely profitable. Your blended margin here is around 74 percent and looks fine. But that 74 percent is the light segment carrying the heavy one. If your growth comes disproportionately from heavy users, which it will if your product is genuinely valuable, your blend marches toward the heavy-segment margin of 41 percent over time. The average was not lying about today. It was lying about your trajectory.
This is the discipline: price and package so that each segment is independently profitable, not so the average looks good. A model where light users subsidize heavy ones is stable only as long as your mix does not shift toward heavy, and a successful product's mix always shifts toward heavy.
The four levers, and a sensitivity model
Once you see margin as a distribution, you can ask which levers move it. There are exactly four variable-cost levers worth modeling, and they do not move margin equally.
- Output length. Output tokens cost three to five times input. Cutting average output length is often the single highest-use, lowest-risk margin improvement available, and it usually improves the product too because terse answers beat rambling ones.
- Caching hit rate. Cached input runs at roughly 10 percent of full price. Moving cache hit rate from 0 to 60 percent on a context-heavy workload can cut input cost by more than half.
- Model price and routing. Routing easy units to a cheap model (GPT-4.1 Mini at $0.40/$1.60, Haiku at $1/$5) and reserving the flagship for hard ones changes blended cost dramatically. The price of any single model also drops over time, which the final chapter treats as a strategic variable.
- Reranking and retrieval depth. How many candidates you retrieve and how aggressively you rerank trades quality against cost; tuning it is a margin lever with a quality ceiling.
Here is a sensitivity model you can adapt. It computes margin under a base case and then perturbs each lever, so you can see which one is worth engineering effort.
def margin(price, out_tokens, cache_hit, model_in, model_out,
 in_tokens=12000, rerank_cost=0.006, fixed_other=0.03):
 eff_in = in_tokens * (1 - cache_hit) + in_tokens * cache_hit * 0.10
 cost = (eff_in * model_in
 + out_tokens * model_out
 + rerank_cost + fixed_other)
 return (price - cost) / price

base = margin(price=0.30, out_tokens=2000, cache_hit=0.0,
 model_in=3e-6, model_out=15e-6)

scenarios = {
 "cut output 50%": dict(out_tokens=1000),
 "cache 60%": dict(cache_hit=0.60),
 "route to mini": dict(model_in=0.4e-6, model_out=1.6e-6),
 "cache + shorter out": dict(out_tokens=1000, cache_hit=0.60),
}
Run that and the lesson is consistent across most real workloads: the cheapest margin wins come from output length and caching, the biggest come from model routing, and the combination of all three frequently turns a marginal 40-something-percent unit into a comfortable 70-something. You should know these numbers for your own product before you ever touch the price, because changing the cost is often easier, faster, and less disruptive than changing the price.
The tail is where you die
Averages and even segment margins still smooth over the thing that actually causes the emergency: the tail of the unit-cost distribution within a single customer.
Recall from the work-unit chapter that one work unit does not have one cost. A "reviewed contract" might be two pages or two hundred. A "resolved ticket" might take one model call or twenty. Within a single customer paying a flat per-unit price, the units have a cost distribution, and the tail of that distribution can be vicious. If 2 percent of units cost fifty times the median, those 2 percent can consume more cost than the other 98 percent combined while paying the same per-unit price.
This is why the within-unit variance measurement from the work-unit chapter matters so much. A flat per-unit price is an average price, and it is only safe if the cost distribution within the unit is reasonably tight. When it has a fat tail, a flat price means you are systematically underpricing the expensive units and overpricing the cheap ones, and any customer whose mix skews toward expensive units becomes a margin hole.
You have three defenses against the tail, and you should usually deploy more than one:
- Tier the unit. Define "standard" and "complex" versions of the work unit with different prices, so the expensive tail pays for itself. A standard contract review and a complex one are different products at different prices.
- Cap the unit. Set a cost ceiling per unit in the product itself: a maximum output length, a maximum number of agent steps, a timeout. Beyond the cap, the unit degrades gracefully or routes to a different path. This bounds your tail in the architecture, not just the contract.
- Meter the tail. Price the predictable majority as flat work units and add a metered component for the heavy tail, so the customers who actually generate the expensive units pay for them.
Set a margin floor and defend it
Every AI product should have an explicit per-unit margin floor, a minimum gross margin below which a unit must not be sold, and it should be enforced in both pricing and engineering. The floor is a business decision tied to your model: an AI-native product might target 50 to 60 percent, an AI-enabled product 60 to 79, an AI-augmented product 80, ranges consistent with how practitioners now segment AI P&L profiles. Pick yours deliberately.
The floor does two jobs. In pricing, it sets the minimum price for any work unit: cost-stack-to-the-floor, never below. In engineering, it sets a budget: if a feature cannot be built to serve a unit under the floor, it is not ready to ship at the planned price, and the team either cuts cost (the four levers) or raises price before launch, not after. The discount-happy enterprise deal that quietly sells units below the floor is how a company books revenue and loses money on its best logos. The floor is the guardrail that makes "we won the deal" and "the deal is profitable" the same sentence.
The dynamic problem: cost falls, but so might your price
There is a forward-looking trap worth naming here, though the final chapter handles it in full. Model API prices fall over time, sometimes sharply. It is tempting to assume falling costs will fix any margin problem automatically. They might, but two things complicate it.
First, falling per-token prices often coincide with deeper agentic workflows that use more tokens per unit, so your unit cost can hold steady or rise even as the price per token falls. Second, when input costs fall, competitive pressure tends to push your prices down too, so the margin improvement gets competed away rather than retained. Cost decline is a tailwind you should plan to capture deliberately, by holding price while cost falls, rather than a rescue you can assume. Build your margin model on today's costs, not on hoped-for future ones, and treat any future cost decline as upside you have to actively defend rather than a problem that solves itself.
Practical exercise
Build the three-segment margin table for your own customer base this week. Light, mid, heavy by AI usage. Compute revenue share, COGS share, and margin for each. Then ask the one question that matters: is your heaviest segment independently profitable, or is it being carried by your lightest? If it is being carried, your blended margin is a countdown timer, and the packaging, quota, and contract chapters are how you stop the clock.
Key Takeaways
- Blended gross margin is nearly meaningless for AI products because it hides the distribution of margin across customers and units.
- Margin is a function of customer mix; a successful product's mix shifts toward heavy users, dragging the blend toward the heavy-segment margin.
- Model margin by segment (light, mid, heavy) and require each segment to be independently profitable, not just the average.
- The four cost levers are output length, caching, model routing, and retrieval/rerank depth; cheap wins come from output and caching, big wins from routing.
- The within-unit cost tail causes the emergencies; defend it by tiering the unit, capping it in the product, and metering the heavy tail.
- Set an explicit per-unit margin floor and enforce it in both pricing and engineering; treat future cost declines as upside to defend, not a rescue to assume.
Internal map
For the larger argument, keep this chapter connected to Pricing Software That Thinks, Revenue, Re-Engineered, the smaller-model margin argument, and The Economics of Inference.