Benchmarks Are Not Business Cases
A benchmark number tells you how a model did on someone else's test, and translating it to your business is work that the leaderboard will not do for you.

Read this alongside the First Principles AI book, the AI-Native thesis, and the full book library when you want the surrounding argument. A model release crosses your feed with a chart. The new model scores 71 on some benchmark; the previous best scored 64; a bar is taller than another bar; the caption says "state of the art." Within an hour someone in your company has cited that number as a reason to switch vendors, pause a project, or revise a forecast. The number did real work. The trouble is that the work it did had almost nothing to do with your business, and this chapter is about why, and what to measure instead.
I am not anti-benchmark. Benchmarks are how the field makes progress legible, and without them we would be back to dueling demos. What I am against is the move that happens silently in that meeting: treating a number from someone else's test as if it were a number from your own operation. A benchmark answers the question "how did this model do on this specific task, scored this specific way, on this specific data." Your business case answers a different question: "how much value does this model produce, net of cost, in my workflow, on my data, for my users." Those questions share no terms. The translation between them is the work, and the leaderboard does none of it.
Why benchmarks saturate, and what that tells you
Start with a fact that should make anyone cautious about reading benchmark deltas as progress. According to the Stanford AI Index, three benchmarks introduced in 2023 to stress the frontier, MMMU, GPQA, and SWE-bench, saw scores jump within a single year by 18.8, 48.9, and 67.3 percentage points respectively (Stanford HAI, 2025 AI Index Report). Benchmarks designed to last years were largely solved in months.
There are two innocent reasons for this and one less innocent one, and you should hold all three in mind. The innocent reasons: models genuinely got better, and the field is moving fast. The less innocent one: when a benchmark becomes a target, it gets optimized against, directly or indirectly, and stops measuring what it was built to measure. This is Goodhart's Law applied to AI, and it is not hypothetical. Benchmark data leaks into training sets, intentionally or through web-scale scraping, so that the model has effectively seen the test. Labs tune on the public examples. The number goes up; the underlying general capability goes up by less. A rising benchmark is a mix of real progress and target-chasing, and from the outside you cannot cleanly separate the two.
The practical consequence is that a benchmark delta of a few points is mostly noise for your purposes. The signal in benchmarks is coarse: a model that scores 30 and a model that scores 70 on a relevant task probably do differ in capability you would feel. A model that scores 71 versus one that scores 69 is a difference that will vanish the moment you put it on your data, where the benchmark's careful conditions do not apply. Read benchmarks for the order of magnitude of capability, not for the leaderboard ranking.
The four ways a benchmark fails to be your business case
There are four specific gaps between any benchmark and your decision, and naming them lets you interrogate a number instead of being moved by it.
The task gap. The benchmark task is not your task. SWE-bench measures whether a model can resolve issues in open-source Python repositories with tests. That is a real and hard task. It is also not "write the feature my team needs in our proprietary codebase with our conventions and our missing tests." A high SWE-bench score is evidence about the benchmark's task and weak evidence about yours, to the degree your task differs, which is usually a lot.
The data gap. The benchmark data is public, curated, and clean. Your data is private, messy, and shaped by your specific history. Models perform very differently on public data they may have partly seen during training versus your private data they have never seen. This gap alone routinely turns a benchmark-leading model into a middling performer on a real corpus.
The metric gap. The benchmark scores one thing, usually accuracy on a well-defined answer. Your business cares about a bundle: accuracy, yes, but also cost per call, latency, the cost of the specific errors it makes, and whether errors are detectable. A model can win on benchmark accuracy and lose on your real objective because its errors are expensive and silent while its competitor's are cheap and loud.
The condition gap. The benchmark runs under ideal conditions: best prompt, no rate limits, no integration overhead, no concurrent load, generous compute. Your production runs under your conditions: your prompts, your latency budget, your concurrency, your cost ceiling. The published number is a ceiling under laboratory conditions, not a floor you will see in your stack.
The benchmark-to-business translation table
Because this translation is the work, I keep it as an explicit artifact. When a benchmark number is being used to justify a decision, we fill this out before the decision, and the act of filling it out usually demotes the number from "reason" to "weak prior."
| Benchmark says | Your business needs to know | How to get your number |
|---|---|---|
| Accuracy on a public task | Accuracy on your task, your data | Offline replay on your labeled historical cases |
| "State of the art," some score | Whether the delta survives your data | Run both candidate models on the same replay set |
| Scored under ideal conditions | Performance under your latency and cost ceiling | Measure cost per useful outcome and p95 latency at your concurrency |
| Single-answer correctness | Cost of the errors it actually makes | Categorize errors by cost and detectability, not just count them |
| One model, one task | Fit across your real workflow mix | Replay across the distribution of tasks you actually run |
| A point estimate | Stability over time and model updates | Re-run the replay on a schedule; watch for drift |
The right-hand column is the same instrument from the last chapter, offline replay, pointed at the benchmark problem. Your labeled historical data is a benchmark, the only one that scores your task, on your data, against your metric, under conditions closer to yours. It is almost always more decision-relevant than any public leaderboard, and you already own it. The reason teams reach for the public number instead is that it is free and instant, while your own benchmark costs a few days to build. Those few days are the cheapest insurance you will ever buy against switching vendors for a delta that does not survive contact with your corpus.
Cost as a benchmark axis nobody charts
The leaderboards almost never put cost on an axis, and cost is often the axis your business case turns on. Recall the inference-cost collapse: a GPT-3.5-level capability fell from about twenty dollars per million tokens to about seven cents in two years, more than a 280-fold drop (Stanford HAI, 2025 AI Index Report). That single fact reframes most benchmark comparisons, because it means the relevant question is rarely "which model is most capable" in the abstract. It is "what is the cheapest model that clears the capability bar my task actually requires."
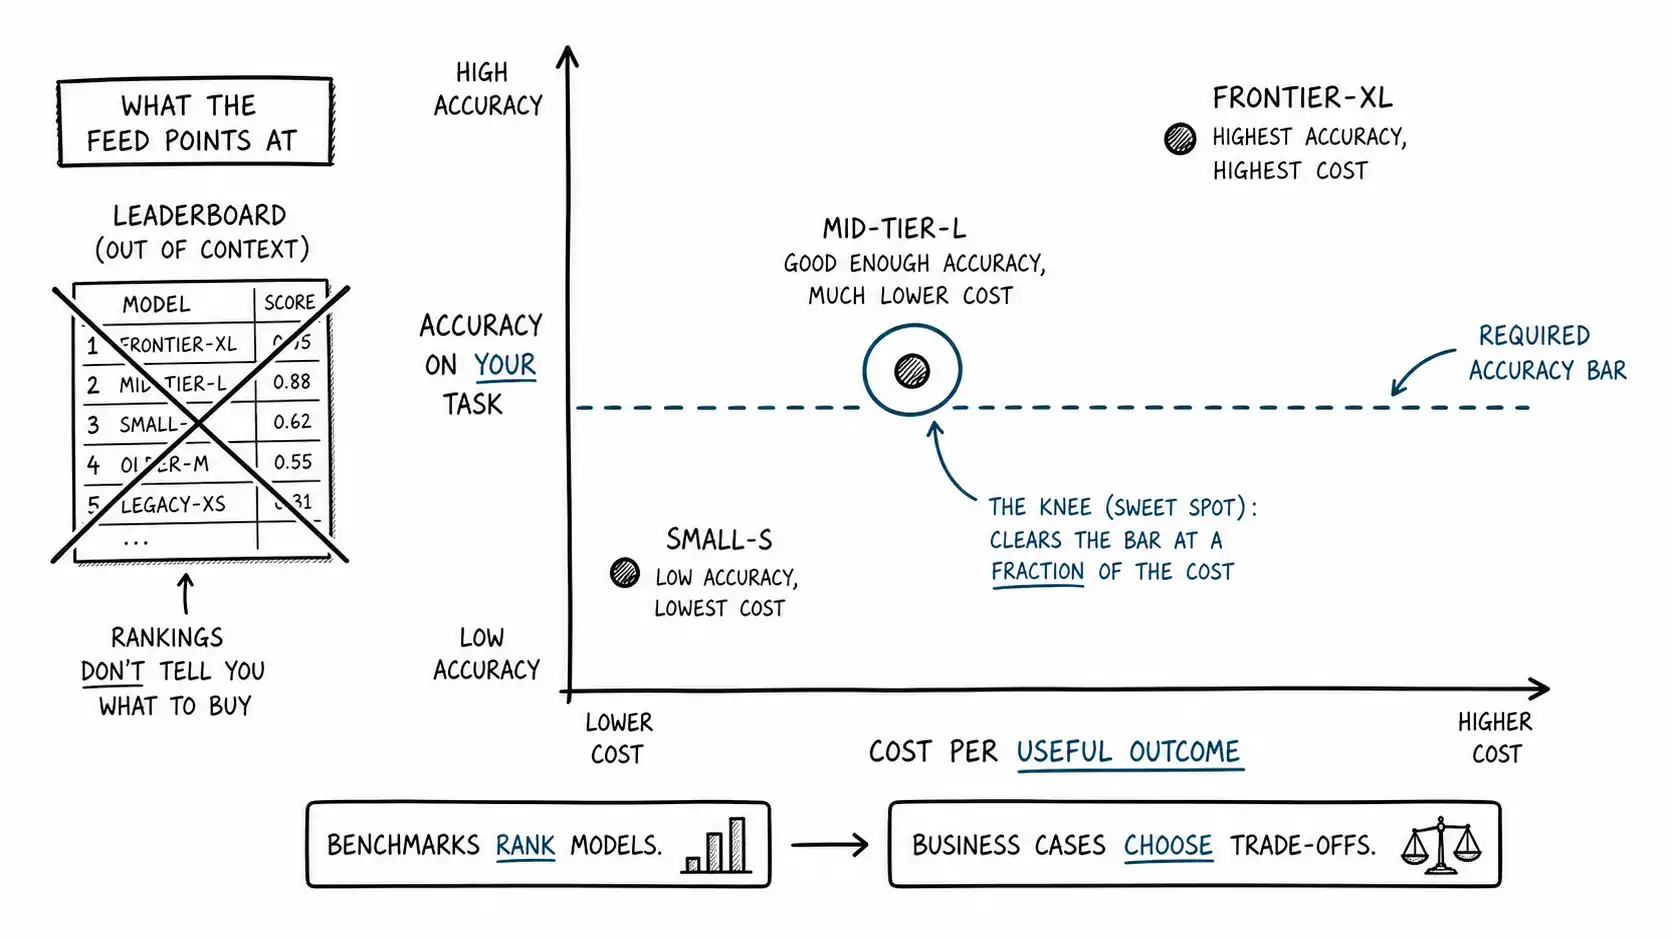
This is the move that separates operators from spectators. The spectator asks which model tops the leaderboard and reaches for it. The operator asks what accuracy the task genuinely needs, finds that a model two tiers down the leaderboard clears it at a tenth the cost and a quarter the latency, and ships that one. For a huge share of real workloads, the frontier model is overqualified and overpriced, and the benchmark-leading number is precisely the wrong thing to optimize. The right artifact here is a cost-accuracy frontier built on your own replay: plot each candidate model's accuracy on your task against its cost per useful outcome, and pick the knee of the curve, not the top of the leaderboard.
COST-ACCURACY FRONTIER (built on your replay, illustrative numbers)

 model your-task acc cost / useful outcome p95 latency
 frontier-XL 0.91 $0.140 4.2s
 mid-tier-L 0.88 $0.022 1.1s
 small-S 0.79 $0.004 0.4s

 task requires: >= 0.85 acc, <= 2.0s latency, cost matters

 decision: mid-tier-L. It clears the bar at 1/6 the cost and 1/4
 the latency of the leaderboard leader, which is overqualified here.
That table is hypothetical in its numbers but exactly the shape of the analysis that has changed real decisions I have made. The benchmark would have pointed at frontier-XL. The business case pointed at mid-tier-L. The gap between those two answers is the entire subject of this chapter.
Errors are not interchangeable
One more thing the leaderboard flattens: it treats all errors as equal, and your business does not. A benchmark counts a wrong answer as one error. Your operation experiences errors as a distribution of consequences, and the shape of that distribution often matters more than the count.
Consider two models scoring identically on accuracy, say 92 percent, on your task. Model A's eight percent of errors are random and loud: it says "I'm not sure" and routes to a human. Model B's eight percent of errors are confident and silent: it produces a wrong answer with full conviction. These models are not equivalent. Model A is shippable with a review queue; its errors are caught. Model B can be a liability, because its errors reach customers undetected and you find out from complaints or a regulator. Same benchmark score, opposite business cases.
So when you translate, do not just measure how often the model is wrong. Categorize the errors by cost (cheap to fix versus catastrophic) and by detectability (the model flags its uncertainty versus it does not). A model that is wrong more often but always flags it can be worth more than one that is wrong less often and hides it. No public benchmark will tell you this. Your replay, scored with your error taxonomy, will.
A short rule for reading any leaderboard
When a benchmark chart crosses your feed, run it through three questions before you let it touch a decision. Is the benchmark's task close to mine, or far? Was the model scored on data like mine, or on public data it may have trained on? Does the metric being charted include the things my business actually pays for, cost, latency, and the cost of errors, or only accuracy? If the answers are far, public, and accuracy-only, which they usually are, then the number is a weak prior at best. It earns the right to move your decision only after it survives your own replay. Until then it is allowed in the room. It does not get to run the meeting.
Summary
A benchmark answers how a model did on someone else's task, scored someone else's way, on someone else's data, under ideal conditions. Your business case is a different question entirely, and the translation is real work the leaderboard will not do. Benchmarks saturate fast, partly through genuine progress and partly through target-chasing, so read them for order-of-magnitude capability, not for two-point rankings. Build your own benchmark from labeled historical data, plot a cost-accuracy frontier rather than chasing the top score, and score errors by cost and detectability rather than counting them. The model your business should run is usually not the one the leaderboard crowns.
Key Takeaways
- A benchmark answers "how did this model do on this task, scored this way, on this data, under ideal conditions." Your business case is a different question, and the gap between them is the work.
- Benchmarks saturate fast: 2023 benchmarks gained 18 to 67 points in a year, from a mix of real progress and target-chasing. Read deltas as order of magnitude, not as rankings.
- Four gaps separate any benchmark from your decision: task, data, metric, and condition. Name them to interrogate a number instead of being moved by it.
- Your labeled historical data is the only benchmark scored on your task, your data, your metric. Build it. It costs a few days and it is the cheapest insurance against switching for a delta that does not survive your corpus.
- Cost is the axis leaderboards omit and your case often turns on. With inference cost having fallen 280-fold in two years, the question is rarely "most capable," it is "cheapest model that clears the bar."
- Errors are not interchangeable. Categorize them by cost and detectability. A model wrong more often but flagging it can beat one wrong less often that hides it. No leaderboard tells you this.
- Before a benchmark touches a decision, ask: close task or far, my data or public, full business metric or accuracy only. Usually it is a weak prior until it survives your own replay.