ROI That Survives Contact
The headline value is the easy part. The fragile assumptions underneath it are what burned the last buyer.

A finance partner once stopped my ROI slide with a single sentence: "Show me the denominator."
I had a beautiful numerator. Hours saved, multiplied by a loaded labor rate, annualized, with a confident arrow pointing up and to the right. What I did not have, what she was asking for, was the full cost of producing those savings: the per-call inference cost at her real volume, the human review time, the integration labor, the cost of the cases the model got wrong, and the cost of the cases where a human had to redo the model's work. The numerator was real. The denominator was missing. And a missing denominator is exactly how the last vendor's ROI model inverted on her, which is why she now asks for it first and treats any seller who cannot produce it as a repeat of the disappointment.
This chapter is about building ROI numbers that survive contact with cost, latency, and review. Not because honest ROI is a virtue, though it is, but because the N in the BURNED Diagnostic, numbers that did not survive, is the failure mode finance carries forward most aggressively, and a fragile ROI model is the fastest way to confirm a CFO's worst expectation of you.
Why AI ROI is structurally fragile
Traditional software ROI is relatively stable. You pay a license, you get a capability, the cost is mostly fixed and known. AI ROI is structurally different in three ways that each create a hidden assumption.
First, the cost is usage-driven, not seat-driven. A model that costs very little per call at demo volume can cost a great deal at production volume, and the relationship is not always linear because higher volume can mean longer or more complex inputs. The per-seat mental model that buyers and sellers default to systematically understates AI cost. Finance knows this now, because the last vendor quoted per-seat and the bill came in per-token.
Second, the value is probabilistic, not deterministic. A deterministic tool that automates a task captures close to the full value of that task. A probabilistic tool captures the value only on the cases it handles well, and on the cases it handles poorly it can actually create negative value, because a human now has to detect the error, correct it, and sometimes redo the work from scratch. The MIT NANDA research found the strongest returns in back-office automation where the value was concrete and the workflow well-bounded, and the weakest where the integration into human work was loose (MIT, "The GenAI Divide," 2025). The lesson for the ROI model is that you cannot claim full task value. You can only claim value net of the failure cases.
Third, the value requires sustained adoption, which is not free. A tool that saves time only if operators use it correctly and consistently carries an adoption cost: training, change management, and the productivity dip while people learn. ROI models routinely assume instant, perfect adoption, which never happens, and the gap between assumed and real adoption is where projected savings evaporate.
Each of these is a hidden assumption. The honest move is to surface them, put a number on each, and show the buyer what happens when they are wrong. That is a sensitivity model, and it is the single most credible artifact you can bring to a scarred finance team.
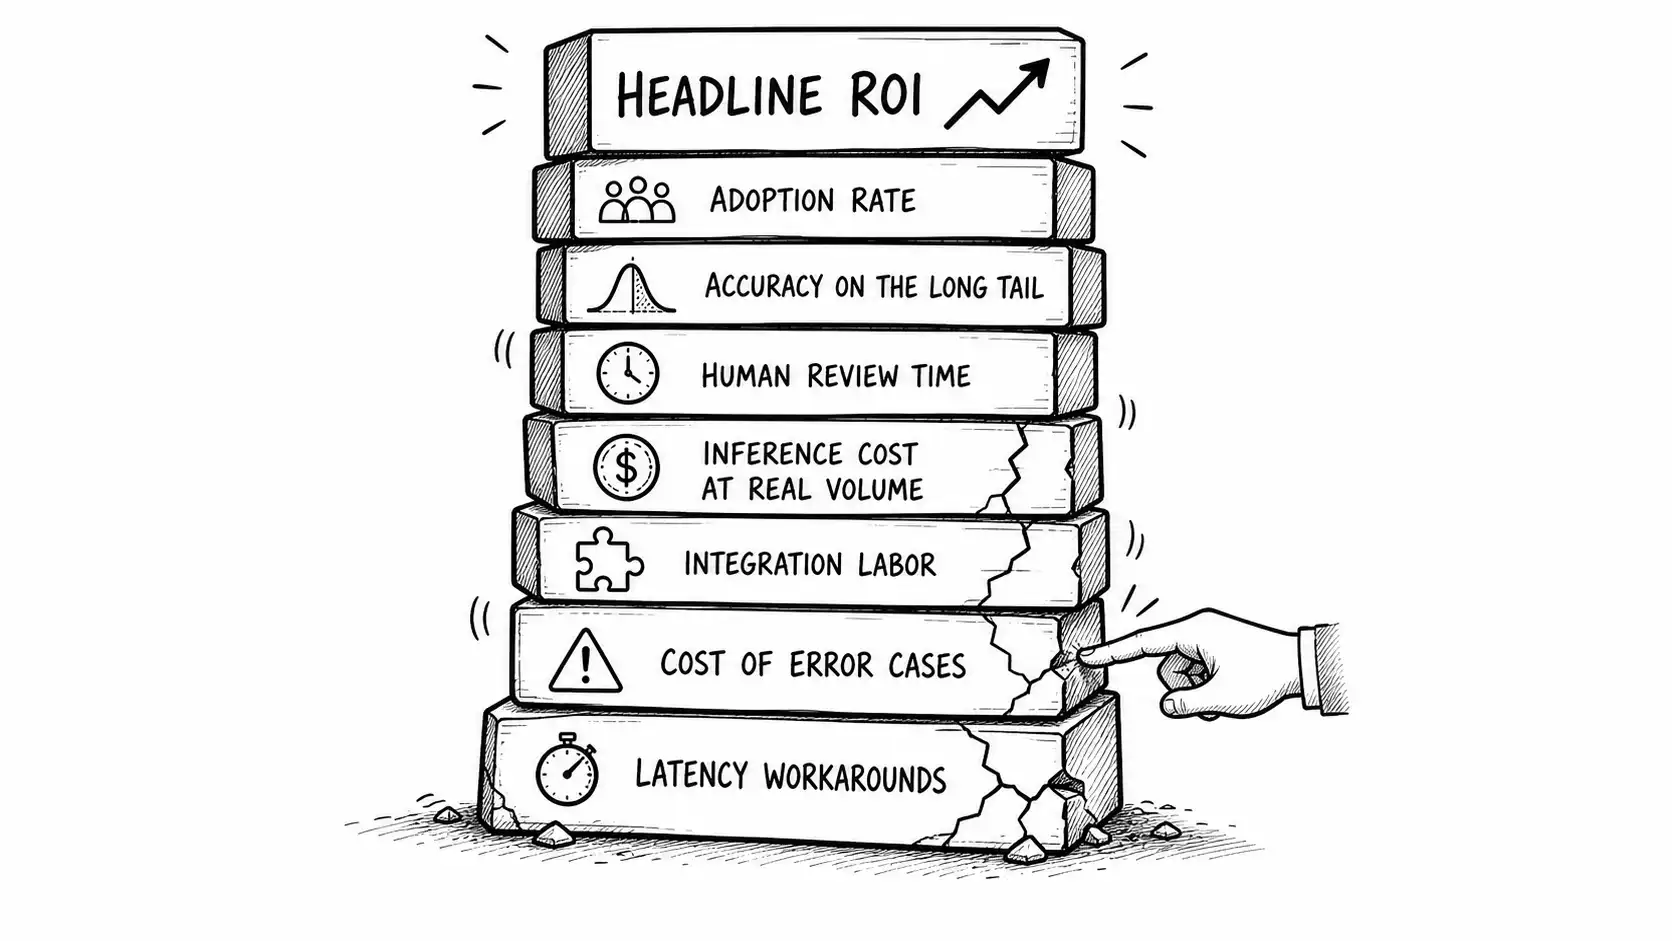
The ROI assumption stack
Picture the headline value as the top of a stack, resting on layers of assumptions. The buyer can see the top. The last vendor hid the layers. Your job is to draw the whole stack.
The layers, from headline down to foundation:
- Headline value: hours saved times loaded rate, annualized. The number on the slide.
- Adoption rate: what fraction of the eligible work actually flows through the tool, and how fast it ramps.
- Accuracy on the long tail: the real no-edit or auto-resolve rate on production inputs, not the benchmark.
- Human review time: the labor cost of reviewing model outputs, which does not disappear and sometimes grows.
- Inference cost at real volume: the per-unit compute or API cost multiplied by actual production volume.
- Integration and maintenance labor: the IT cost to connect and keep it connected.
- Cost of error cases: the cost when the model is wrong, including detection, correction, and rework.
- Latency workarounds: any cost incurred because the model is too slow for the workflow and people route around it.
A headline ROI that ignores the lower layers is not a projection. It is a wish. Finance was burned by exactly this wish last time. Drawing the full stack, with a number on each layer, is how you demonstrate you are not selling them the wish again.
A worked ROI sensitivity model
Numbers make this concrete. Here is a hypothetical model, labeled hypothetical, for an AI tool drafting customer support responses. Round numbers for clarity.
Baseline assumptions:
- Volume: 100,000 tickets per year eligible for the tool.
- Human-only baseline: 8 minutes per ticket at a loaded rate of 45 dollars per hour, so 6.00 dollars per ticket, 600,000 dollars per year.
- Vendor claim: tool drafts a response the agent can send with no edit, cutting handle time to 3 minutes on handled cases.
Now the layers that determine whether the claim survives:
| Assumption | Optimistic | Realistic | Pessimistic |
|---|---|---|---|
| Adoption (share of eligible tickets) | 90% | 70% | 50% |
| No-edit rate on handled tickets | 75% | 60% | 45% |
| Time on no-edit ticket | 3 min | 3 min | 3 min |
| Time on edited ticket | 6 min | 7 min | 8 min |
| Inference cost per ticket | 0.05 | 0.12 | 0.25 |
| Review/oversight overhead per ticket | 0.10 | 0.30 | 0.60 |
| Annual integration + maintenance | 30,000 | 60,000 | 100,000 |
Run the realistic column. Of 100,000 tickets, 70,000 flow through the tool. Of those, 60 percent (42,000) take 3 minutes (2.25 dollars each) and 40 percent (28,000) take 7 minutes (5.25 dollars each). The remaining 30,000 tickets stay at the 6.00 dollar baseline. Tool-handled labor: 42,000 times 2.25 plus 28,000 times 5.25 equals 94,500 plus 147,000, so 241,500 dollars. Non-tool labor: 30,000 times 6.00 equals 180,000. Total labor: 421,500. Add inference (70,000 times 0.12 equals 8,400), oversight (70,000 times 0.30 equals 21,000), and integration (60,000). Total realistic cost: 510,900 dollars against a 600,000 baseline. Net savings: about 89,000 dollars, before counting the platform license.
That is a real, defensible number, and it is a fraction of what the optimistic column would have shown. Now run the pessimistic column and you find the savings can go negative once the license is added: low adoption and a low no-edit rate mean the tool barely displaces labor while adding inference, oversight, and integration cost on top. That negative scenario is not a reason to hide the model. It is the most valuable thing you can show finance, because it tells them exactly which assumptions the whole case depends on, which are adoption and no-edit rate, which means those two numbers become the metric in the Honest Pilot Contract. The ROI model and the pilot metric are the same conversation.
Bringing this to finance
When you put a sensitivity model in front of a scarred CFO, the dynamic changes immediately. You are no longer the optimistic seller asking them to believe a number. You are a peer who has already done the conservative analysis they were about to demand, and who has surfaced the downside before they had to dig for it. The behavioral effect is the same one we have seen throughout: you have told them where the floor is before they stepped on it.
A few disciplines make the model credible rather than just elaborate.
Show the pessimistic case without flinching. A model that only has optimistic and realistic columns is still selling. The pessimistic column, presented as a real possibility with the assumptions that produce it, is what separates you from the last vendor. Finance trusts the seller who shows them the bad case.
Tie the fragile assumptions to the pilot. The two or three assumptions the model is most sensitive to should become the pilot's success metric. This is the connective tissue between this chapter and the Honest Pilot Contract: the pilot exists to measure the exact assumptions the ROI depends on. "Our model is most sensitive to the no-edit rate, so that is precisely what the pilot will measure on your real data" is a sentence that earns a finance team's trust because it shows you know where your own case is weak.
Count the cost of being wrong. The error-case cost is the layer sellers omit most often and finance fears most. When the model is wrong and a human has to catch it, correct it, and sometimes apologize to a customer, that has a cost. Putting even a rough number on it shows finance you understand that a probabilistic system is not free on its failures.
Use a per-unit number, not just an annual one. Finance can reason about 0.40 dollars per ticket far better than about a six-figure annual figure, because the per-unit number scales transparently with volume and exposes the usage-driven cost structure that burned them last time. A per-unit cost that is honest, including inference, oversight, and amortized integration, is the single most useful number you can give a CFO.
The ROI assumption table as an artifact
Beyond the sensitivity model, keep a standing ROI assumption table that you fill in for every deal. It forces the hidden layers into the open.
| Assumption | Vendor default | Buyer's reality (to verify) | Source of the number |
|---|---|---|---|
| Eligible volume | estimate | confirm with buyer data | buyer's systems |
| Baseline time per unit | estimate | time-study or buyer estimate | buyer's operators |
| No-edit / auto-resolve rate | benchmark | measure in pilot | shadow run |
| Inference cost per unit | list price | measured at real input sizes | pilot telemetry |
| Review overhead per unit | often assumed zero | observe in pilot | operator time |
| Adoption ramp | often assumed instant | model a 3-6 month curve | change-management history |
| Integration + maintenance | often omitted | get from IT | buyer's IT |
| Error-case cost | almost always omitted | estimate with operators | incident analysis |
The "Source of the number" column is the discipline. Every assumption that traces to a benchmark or a list price is a risk. Every assumption that traces to the buyer's own data or a pilot measurement is evidence. A burned buyer's finance team will, correctly, weight the evidence and discount the assumptions. Your job over the course of the deal is to move as many rows as possible from the assumption category to the evidence category, which again means the pilot is the mechanism: it converts ROI assumptions into ROI evidence.
Latency is a cost line, not a footnote
One layer deserves a closer look because it is so often dismissed: latency. A model that is accurate but slow imposes a real cost, because in many workflows people will not wait. They route around the tool, which destroys adoption, which collapses the value. Or the latency forces an architecture change, like pre-computing or caching, which adds engineering cost. Or the latency degrades the customer experience in a customer-facing flow, which has its own cost. Latency is not a technical footnote. It is an adoption-and-architecture cost line, and on a burned buyer's deal you should ask about the workflow's latency tolerance early, because discovering it late is another flavor of the N scar.
The honest CFO conversation wins the budget battle
There is a temptation to believe that the conservative model loses to the optimistic one, that the seller who promises 600,000 dollars in savings beats the seller who carefully shows 89,000 with a downside risk of negative. In a fresh market, maybe. In a market of survivors, the opposite is true. The CFO who was burned by the 600,000 dollar promise is precisely the CFO who will trust the 89,000 dollar analysis, because it carries the texture of reality they have learned to look for. And an 89,000 dollar savings that actually materializes is infinitely better for your renewal and reference than a 600,000 dollar promise that inverts. Honest ROI is not a smaller sale. It is a sale that survives.
In the next chapter we take the hardest communication problem in the whole motion: how to tell a buyer that the system is probabilistic, that it will sometimes be wrong, without killing the momentum you have built.
Practical Exercise
Build the three-column sensitivity model for your live deal using the worked example as a template. Find the one assumption that, when moved from optimistic to pessimistic, does the most damage to the net savings. That assumption is your pilot metric. Write it into field three of the Honest Pilot Contract before you present any ROI number to finance.
Key Takeaways
- AI ROI is structurally fragile because cost is usage-driven not seat-driven, value is probabilistic not deterministic, and value requires sustained adoption that is never free.
- Draw the full ROI assumption stack, headline value resting on adoption, long-tail accuracy, review time, inference cost, integration, error-case cost, and latency, instead of showing only the top.
- A three-column sensitivity model that includes an unflinching pessimistic case is the most credible artifact you can bring a scarred finance team.
- Tie the most sensitive assumptions to the pilot metric; the pilot exists to convert ROI assumptions into ROI evidence.
- An honest, smaller, survivable number beats an optimistic promise that inverts, because the renewal and the reference depend on savings that actually materialize.