The First Org Chart That Becomes Wrong
The boxes never move, which is exactly why nobody notices the moment the chart stops telling the truth.

Pull up your org chart. Not the slide version, the real one, the directory tree that HR maintains. Now ask a question it was never designed to answer: for each box, what fraction of the work that box is accountable for did that person actually produce, versus generate with a tool and ship without anyone else seeing it?
You cannot answer that question from the chart. That is the problem. The chart records who reports to whom. It says nothing about who produced what, who reviewed what, or who would be on the phone if it broke. We have always tolerated that gap because the gap was small. When production was slow, the volume of work behind each box was bounded, knowable, and roughly reviewed by the box above it. The chart's silence about production and review did not matter, because production and review tracked each other.
Cheap production breaks that coupling, and it breaks it without moving a single box. This is the first org chart that becomes wrong: yours, today, looking exactly as it did last quarter, describing a world that no longer exists.
Conway's law still holds, which is the trap
Melvin Conway's 1968 observation, that organizations design systems which mirror their own communication structures, has aged into one of the few genuinely reliable laws in our field. Conway's law says your architecture will look like your org chart whether you want it to or not, because the interfaces in the software end up tracing the interfaces between the teams. Matthew Skelton and Manuel Pais built Team Topologies on exactly this: if you want a particular software architecture, you engineer the team structure that will produce it, the "reverse Conway maneuver," and you manage each team's cognitive load deliberately rather than by accident.
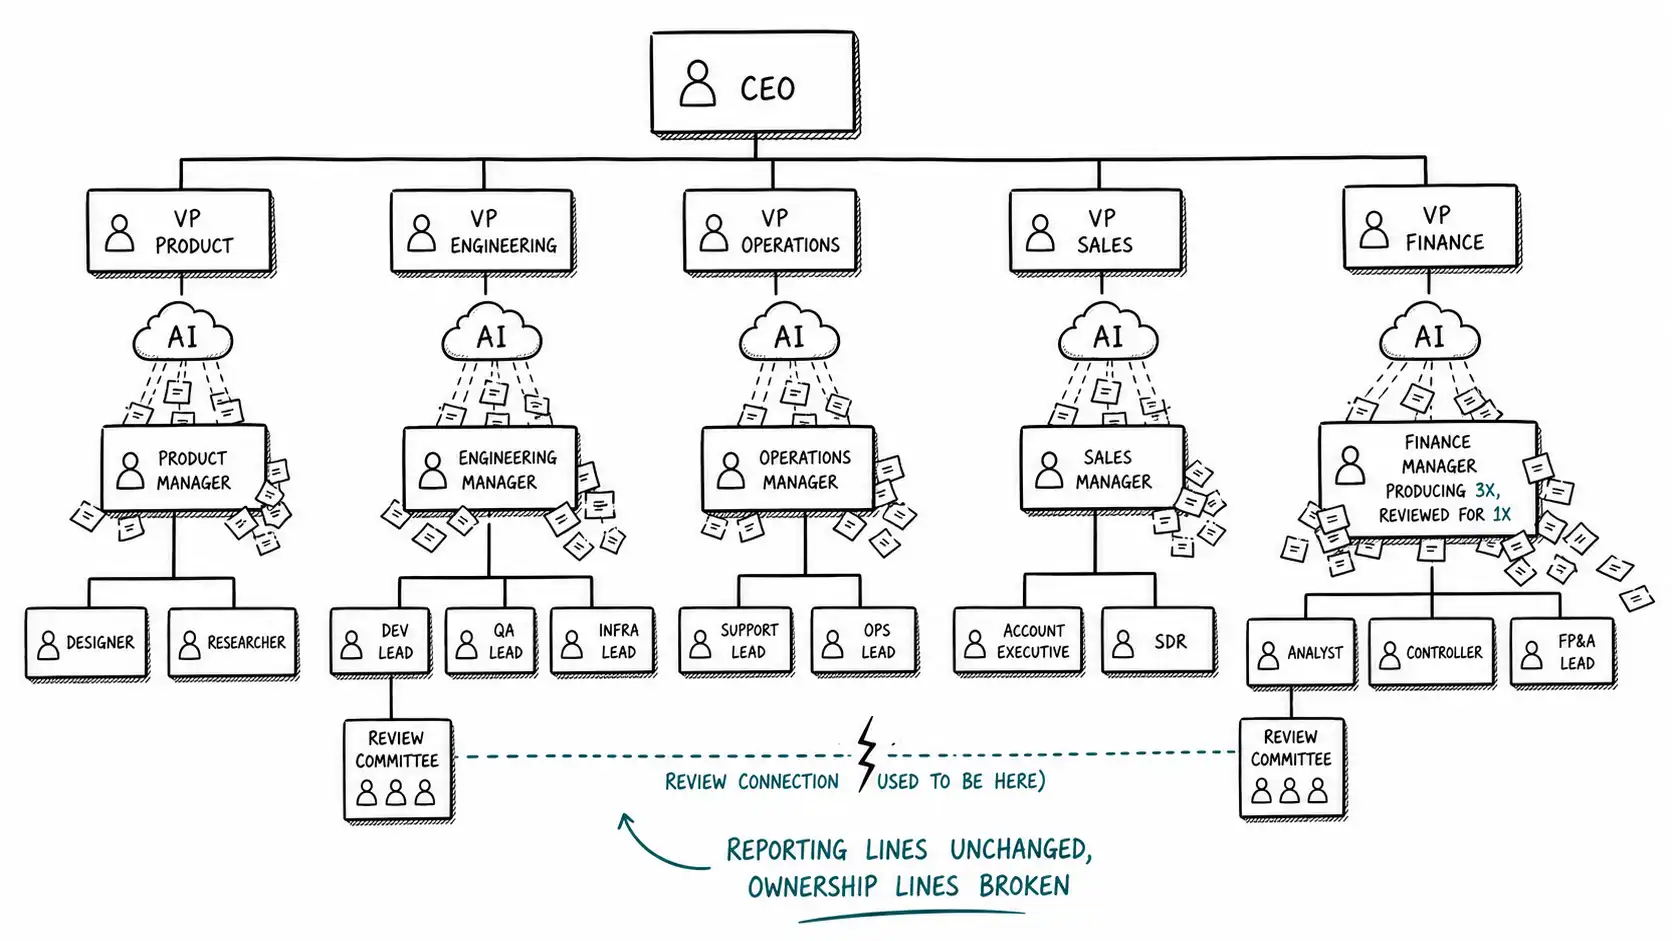
Here is the trap. Conway's law assumes the org chart describes who builds what. AI breaks that assumption from underneath. The chart still shapes the interfaces, the seams between teams, because those are about communication. But it no longer describes the volume or origin of what flows through those seams, because a single person inside a box can now generate output that used to require a whole sub-team. The communication structure is intact. The production structure has detached from it. So you get the worst of both worlds: an architecture still constrained by your team boundaries, flooded with artifacts that no longer map to the people the chart says produced them.
I watched this happen at a company I advised. The chart showed a four-person data team feeding a twelve-person product organization. Clean seams, sensible Conway alignment. Then the product engineers started generating their own queries and pipelines with an assistant, fast, and shipping them without routing through the data team. The chart still said the data team owned the data layer. The reality was that twelve people were now writing data logic the four owners never saw. When a metric silently broke for three weeks, the postmortem asked "who owns this," and the chart confidently pointed at the data team, who had never touched the offending pipeline. The map lied. It pointed at an owner who had no idea the thing existed.
Three things the chart used to encode, and what AI does to each
A reporting line quietly encodes three separate claims. Untangling them is the first diagnostic move in this book.
- Production. This person makes a knowable volume of the work in their domain.
- Review. The person above them sees and judges a meaningful fraction of that work.
- Accountability. That person answers for the consequences, and their manager answers for theirs.
When production was slow, all three claims rose and fell together. A senior who managed four engineers reviewed four engineers' output and answered for four engineers' mistakes, and the numbers were commensurate.
AI cleaves these apart, and it does so unevenly:
- Production multiplies. The studies are consistent on direction even where they disagree on magnitude. The Microsoft and Accenture Copilot trials saw 8 to 22 percent more pull requests per developer per week. A separate field experiment summarized by MIT found larger task-level gains on well-scoped work. Call it a real, durable lift in artifact volume.
- Review does not multiply. Reviewing is reading-plus-judgment, and judgment is exactly the part AI does not accelerate. If anything it gets harder, because the reviewer now reads code or copy they did not write, in a style that is plausible enough to lull them. More on that lull in a later chapter, but for now: review capacity is roughly fixed while review demand climbs.
- Accountability is unchanged but quietly reassigned. Nobody updates the chart, so the chart still says the same people answer for the same domains. But the domains now contain artifacts those people never saw. Accountability did not transfer with the work. It got orphaned.
The chart becomes wrong precisely at the moment claim 1 detaches from claims 2 and 3, and because the boxes do not move, no alarm fires.
The Ownership Compression Pattern
Here is the first of the book's frameworks, and it is the one most organizations are already living inside without naming.
The Ownership Compression Pattern: one role now produces what three used to, which feels like efficiency and is actually a concealed single point of failure.
The pattern looks like a win on every dashboard. Output per head is up. Headcount is flat or down. The CFO's spreadsheet is delighted. What the spreadsheet cannot see is that the judgment, context, and accountability that used to be distributed across three people is now concentrated in one, and that one person is a single point of failure for triple the surface area. They are the only one who understands the pipelines they generated, the only one who remembers which assumptions are load-bearing, the only one who could debug the thing at 3 a.m. The org chart shows a healthy box. It is actually a person carrying three boxes' worth of consequence with one box's worth of backup.
You detect the Ownership Compression Pattern with a single question per person: if this individual were unavailable for two weeks, how much of what they ship could anyone else own? Before cheap production, the honest answer for a mid-level person was "most of it, with some ramp." After cheap production, the honest answer is increasingly "almost none of it, because they generated three times as much and nobody else has the context." That delta is your compression. It is invisible on the chart and lethal in an outage.
The cruel part is that the highest-performing individuals compress fastest. The person who most enthusiastically adopts the tooling, ships the most, and earns the most praise is, by that exact behavior, becoming the most concentrated single point of failure you have. You are rewarding the creation of the risk.
A worksheet to find the lies
You do not redraw the map by staring at the chart. You redraw it by interrogating it. Run this against each team. It takes about an hour per team and it is the most useful hour you will spend this quarter.
| Box / role | Artifacts/week before AI | Artifacts/week now | % shipped without second human seeing it | If gone 2 weeks, % anyone else can own | Compression flag |
|---|---|---|---|---|---|
| Senior backend eng | ~15 PRs | ~30 PRs | 55% | 30% | HIGH |
| Mid analyst | ~8 models | ~20 models | 70% | 15% | CRITICAL |
| Support lead | ~40 responses | ~120 responses | 80% | 50% | MED |
The columns that matter are the last three. "Percent shipped without a second human seeing it" measures how far review has detached from production. "Percent anyone else can own" measures compression. The flag is your judgment call combining both: a role shipping most of its work unreviewed and impossible for anyone else to own is a critical concealed risk, no matter how green its delivery metrics look.
What you do with the flags is the rest of this book. Sometimes the answer is to slow that role's production deliberately. Sometimes it is to split the surface area across more owners. Sometimes it is to build the review capacity the production now demands. But you cannot choose the intervention until you have located the lie, and the chart will not show it to you. The worksheet will.
Why "just update the org chart" is not the answer
You might reasonably conclude that the fix is hygiene: keep the chart current. It is not, for two reasons.
First, the chart's vocabulary is wrong. It has boxes and lines, production and reporting. It has no native way to express "this person produces a lot but owns little," or "this person owns a lot but produces little," or "this artifact stream has no named owner at all." The thing you need to track, the binding of consequence to a human with the capacity to bear it, is not a field on the chart. You can keep the chart perfectly accurate about reporting and still have it be perfectly wrong about ownership.
Second, the failure is not administrative, it is structural. The chart became wrong because the cost of production changed and the operating model did not. Updating the boxes without changing the model just produces a more accurate picture of a broken arrangement. The data team in my earlier example could have been re-drawn to "own all data logic everywhere," and it would have been an honest box describing an impossible job: four people accountable for code twelve people generate and ship faster than four people can read. The right move was not a better chart. It was a different operating model, where production was either routed back through owners or owners were embedded where production happened. That is an operating-model decision, and a later chapter on centralized versus embedded teams is where I work it out in full.
The first thing to do Monday
Before any reorg, before any new role, before any policy, do this: pick your three highest-output teams and find the boxes where production has most detached from review and ownership. You are not looking for bad people or bad work. You are looking for the places where the map has started to lie, because those are the places an incident will originate and the postmortem will discover, too late, that "the owner" never knew the thing existed.
The manager from the introduction got his nerve back partly here. He stopped trusting his chart as a map of ownership and started treating it as a hypothesis to test. Every box was a claim: this person owns this. He went and checked the claims. Most held. A handful did not, and every one that did not was a box where AI had quietly tripled production behind a person whose review and accountability had not moved. He found the lies before they found him.
That is the entire skill. The rest of the book gives you sharper instruments for it, starting with the most common confusion in every AI rollout: the belief that because output went up, capacity went up. They are not the same number, and mistaking one for the other is how the queue eats you.
Key Takeaways
- The org chart encodes three separate claims, production, review, and accountability, that used to rise and fall together and that AI cleaves apart.
- Conway's law still shapes your seams, but it no longer describes the volume or origin of what flows through them, so the architecture stays constrained while artifacts detach from the people the chart names.
- The Ownership Compression Pattern, one role producing what three used to, looks like efficiency on every dashboard and is actually a concealed single point of failure; your best people compress fastest.
- Diagnose it per role with one question: if this person vanished for two weeks, how much of their output could anyone else actually own?
- Do not "just update the chart." The chart has no vocabulary for ownership and the failure is structural, not administrative. Find the lies first, then change the operating model.